Mobile Computing
Mobile Computers, Handheld, Rugged, Wireless (Wi-Fi), GSM and GPRS enabled PDAs and Industrial Computers.Bluefinity adds Data Visualization to Evoke its business app development platform
BlueFinity recently announced a series of popular enhancements to Evoke, its rapid app development platform including Chatbots, signature panel and multiple developer support. Its latest announcement is the introduction of a range of new graphs and charts that can quickly and easily be included as an integral part of apps developed using Evoke.
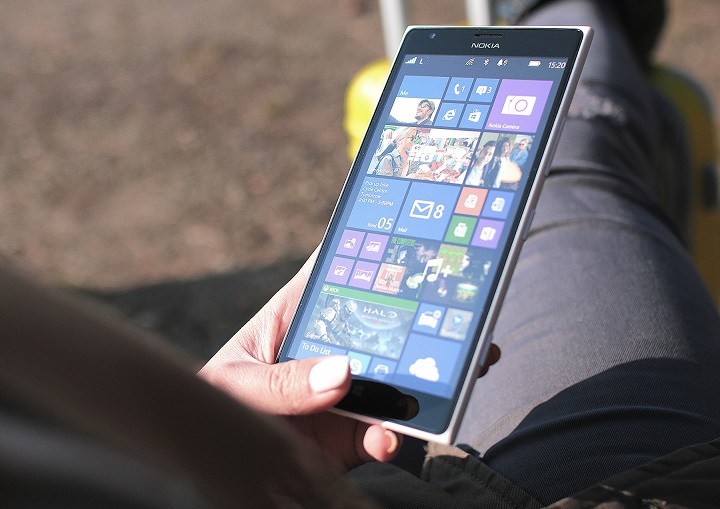
The inclusion of graphics in any application is a very effective way of visualizing important information quickly and clearly. This is even more important when using apps on a smaller screen (iPhone, Tablet etc.). Screen space is limited so graphics can help people understand the data presented and this can be a far more effective method than displaying reports.
Evoke is a cost-effective, rapid app development platform that provides the complete environment for a company’s existing staff to design, develop and deploy business apps across multiple devices (IOS, Android and Windows phones and tablets, plus Windows, Apple and Linux desktops).
Evoke offers a low code or no code route for users to create web, hybrid and even native apps (as it generates in to Visual Studio and Xamarin projects), and to fully integrate and synchronize with existing back-end systems and SQL and MultiValue databases.
As with all aspects of Evoke, graphs are made available across all platforms and device types. The features of Evoke, such as automated resizing according to the screen size, adaptations to design the screen for optimum screen layout and WYSIWYG design capabilities to further customize the layouts for each screen to optimize the UI are all made available when incorporating graphs and charts in to an app.
Evoke Graphs and Charts are made available as an integral part of the Evoke design and development platform. Users can include graphs as a part of the app design without the need to separately incorporate third party software and toolsets. Evoke provides users with everything they need to quickly and easily set-up and configure graphs and charts and it supports multiple types including, Area, Bar, Donut, Line, Percent Area, Percent Bar, Pie, Waterfall etc.
Using Evoke users can define their data, its structure and location. Evoke supports the inclusion of data from multiple files in multiple databases for use within a single app. Users can configure the data fields (columns/attributes) associated with the data, as well as any required calculation and manipulation of the information. Once they have selected the type of chart or graph to use, they can also specify how that data will be grouped for the purposes of presenting on the chart/graph. Users can also refine exactly how they want the chart to appear including type, headers, sub-headers, axis labels, scale and graduation values.
This data visualization feature is the latest in a series of additional functionality releases made by BlueFinity for the company’s fast expanding global client base.
 October 22, 2020 CAR3D, the first European 3D printing project to create Covid-19 protection equipment
- August 3, 2022 New Research Reveals Risk Factors to Business Success in a Post-Pandemic World
- September 25, 2019 New Red Ledge supply chain technology powers systems innovation at Robotics & Automation 2019
- October 27, 2020 The Horrors of Ecommerce Delivery Spell More Tricks Than Treats for Consumers
- August 17, 2021 ExtraHop Extends Response & Forensics Capabilities with Deep Threat Insights for Hybrid Cloud
- March 25, 2019 Compliance Management – it’s time for joined up thinking
- October 27, 2020 Iptor achieves multiple success in Nordics
- December 16, 2019 Merging the physical into the digital – what 2020 holds for OCR
- July 15, 2021 ReverseLogix Names Vice President of Finance